
2.03x
TikTok has 2.03x as many accounts as Instagram and YouTube combined
The study counted 15.8M TikTok accounts, compared with 5.9M Instagram accounts and 1.9M YouTube accounts.
Creator Economy Report 2026
For marketers who need platform benchmarks, audience quality, and creator growth data to plan their next campaign.
Browse country reports See what's inside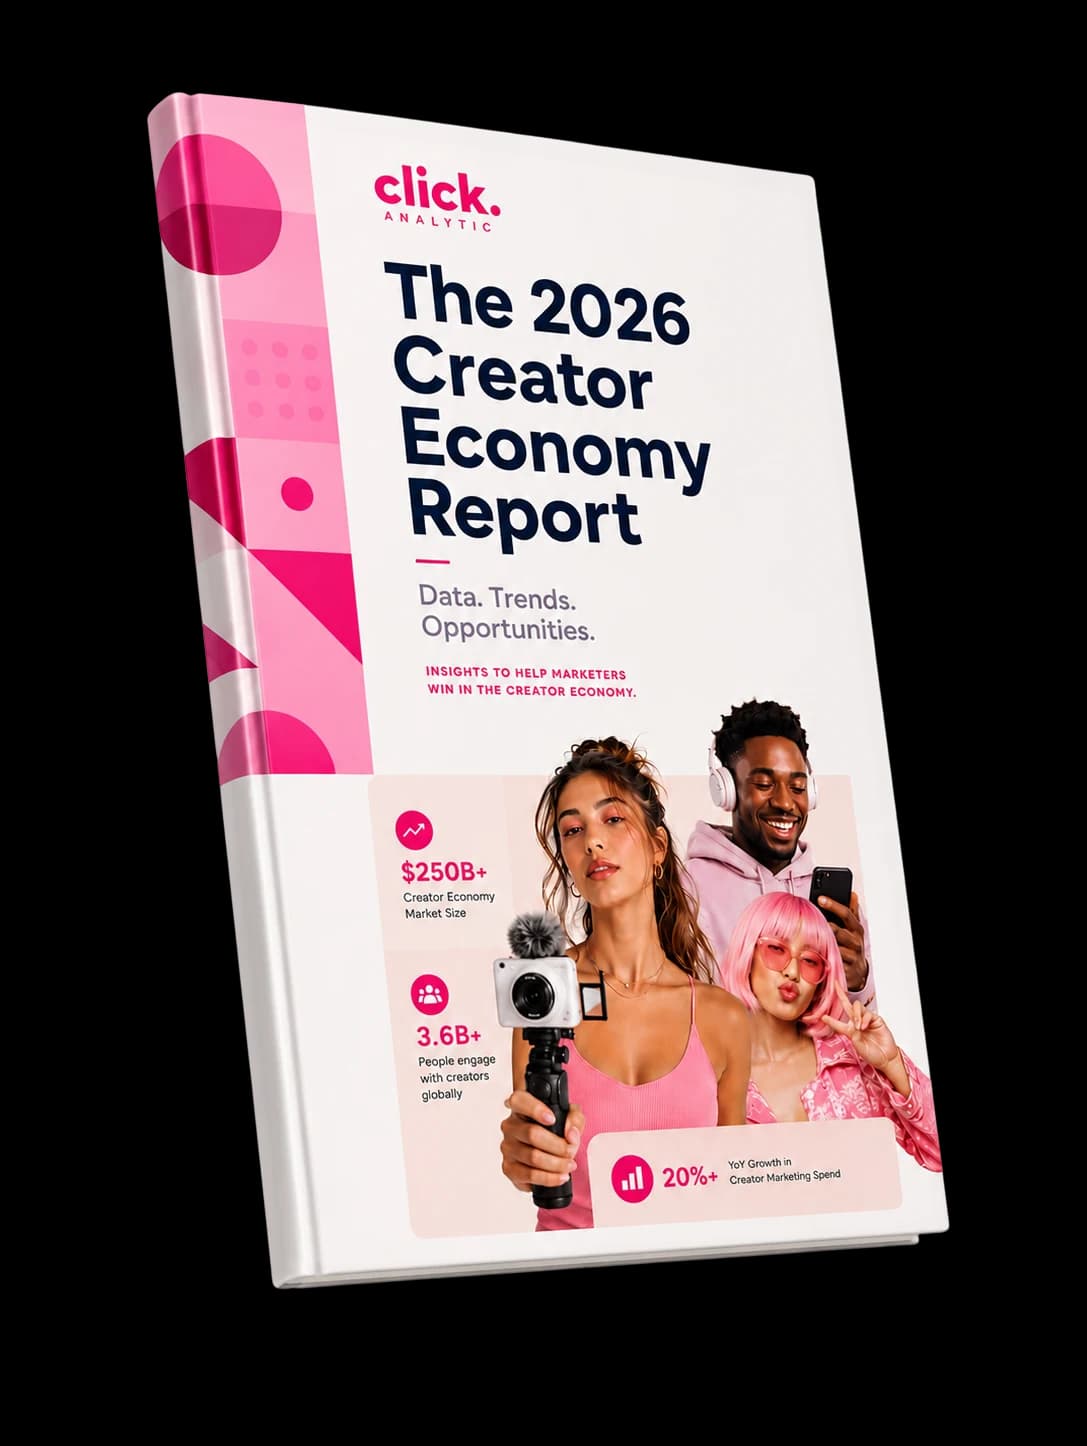
23.6M
platform accounts analyzed, drawn from Click Analytic's 425M+ profile database, with 10K+ followers or subscribers
2025
full-year database snapshot, with measurement dates stated alongside the published findings
25
markets in the published country breakdown, from the US and Brazil to Southeast Asia
3
platforms analyzed: Instagram (5.9M accounts), TikTok (15.8M), YouTube (1.9M)
The creator economy connects independent creators, audiences, brands, and platforms through content and commercial partnerships. This report measures the creator accounts brands can evaluate across Instagram, TikTok, and YouTube.
The study covers 23.6 million platform accounts with at least 10,000 followers or subscribers. These are platform accounts, not deduplicated people. They come from Click Analytic’s larger searchable index of 425M+ public profiles.
The research cohort is distinct from the 425M+ searchable index. Use Click Analytic's creator search to apply the study's platform benchmarks to a current shortlist.
Explore by country
Explore local creator counts, engagement benchmarks, and audience insights. Each country report states its platform coverage and measurement dates.
What this report gives you
The report puts creator supply, contactability, growth, and audience quality in context, using a defined research cohort rather than survey responses.
Source: 23.6M platform accounts with 10K+ followers or subscribers. Full-year 2025 snapshot.
2.03x
The study counted 15.8M TikTok accounts, compared with 5.9M Instagram accounts and 1.9M YouTube accounts.
8.48x
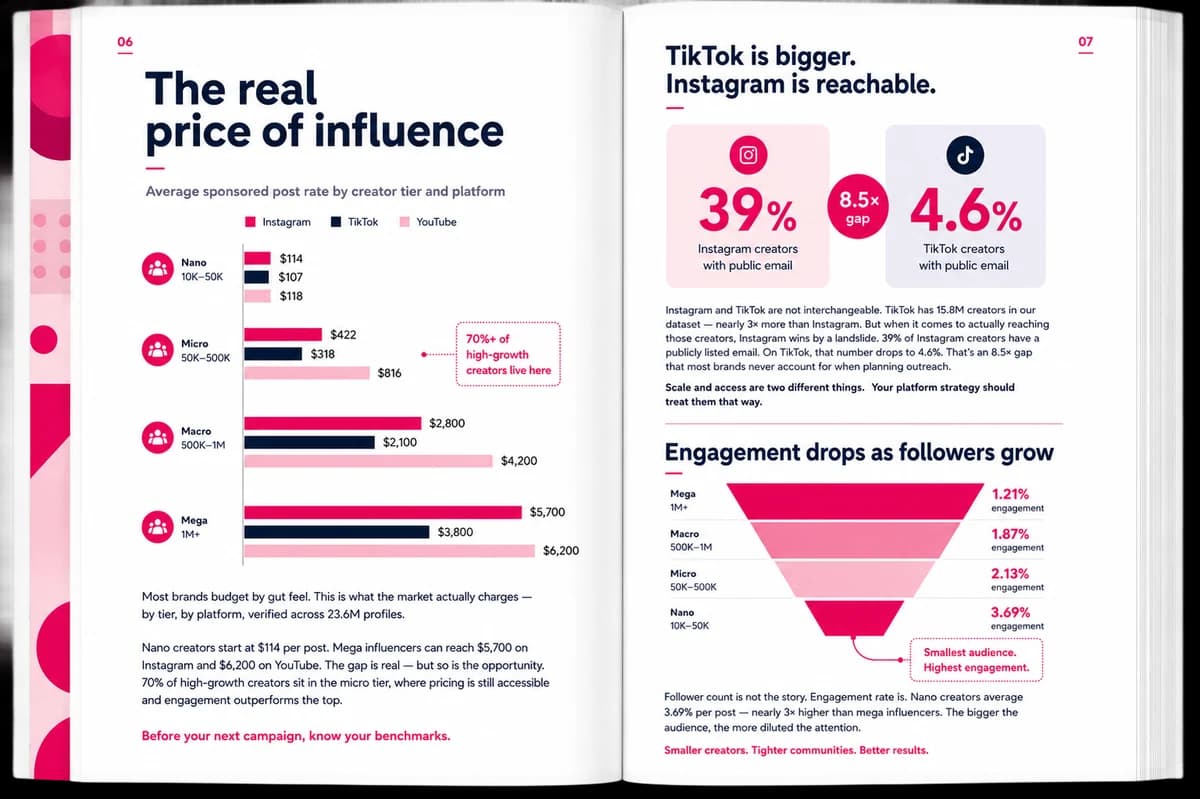
Our study found a public-email listing rate of 39.0% on Instagram and 4.6% on TikTok. The corresponding account counts are about 2.3M and 729K.
30.8%
30.8% of YouTube accounts grew their subscribers by more than 10% over six months, compared with 17.7% on TikTok and 10.4% on Instagram.
Chart · Volume
TikTok has the largest account count in the cohort. Volume measures supply, not contactability.
Chart · Reach
The study reports public-email listing rates of 39.0% on Instagram and 4.6% on TikTok. These are not response rates.
Chart · Growth
Source: Click Analytic, May 2026. Platform-specific six-month growth thresholds.
23.6M
The research cohort contains 23.6M platform accounts at the 10,000-follower or subscriber floor. It is distinct from the 425M+ searchable index.
Source: Click Analytic, May 2026
70.8%
Within the Instagram cohort, 115,700 accounts in the 10K-50K tier represent 70.8% of accounts that grew at least 50% over six months.
Source: Click Analytic, May 2026
14.6%
862,200 Instagram accounts combine good audience quality with at least 2% engagement. This metric is specific to the Instagram cohort.
Source: Click Analytic, May 2026
How this data was built
The research cohort contains 23.6M Instagram, TikTok and YouTube creator accounts with at least 10,000 followers or subscribers. The total counts platform accounts, not deduplicated people.
The cohort was drawn from Click Analytic's searchable index of 425M+ public profiles with at least 1,000 followers. The 25 country breakdowns cover 13.2M of the 23.6M accounts.
The global cohort includes platform accounts with at least 10,000 followers or subscribers.
Instagram, TikTok, and YouTube accounts are counted separately, not as deduplicated people.
The 25 listed markets account for about 13.2M of the 23.6M platform accounts in the global cohort.
The global study uses a full-year 2025 snapshot. Findings cite their source date.
Chart · Platform share
Markets in the published breakdown
Full-year snapshot. Check each finding for its source date.
Who is this creator economy report built for?
Compare creator tiers, platform activity, contactability, and audience quality before committing campaign budget.
Use the published cohort, dated methodology, and market breakdowns when reporting on the creator economy.
Put account performance in context and identify the platform benchmarks that matter for a partnership.
Turn data into action
Click Analytic helps brands find, vet, and manage creator campaigns at scale. Its searchable index covers 425M+ public profiles, while this report studies a defined 23.6M-account cohort.
Try for freeWhat this report gives you
Full dataset includes platform-specific benchmarks and market signals, with each metric’s denominator stated.
5.9M Instagram accounts in the cohort
15.8M TikTok accounts in the cohort
1.9M YouTube accounts in the cohort
Platform-specific pricing benchmarks
25 listed markets
Study methods and definitions
The creator economy is one of the fastest-growing markets in digital media and one of the least understood. Most decisions are still based on individual creator profiles, surface-level metrics, outdated benchmarks, or agency assumptions. That breaks quickly when you scale.
This report takes a different approach. It treats creators as a market - measured, benchmarked, and compared at the same level of rigour that finance teams apply to any other asset class.
TikTok gives you scale. Instagram gives you access. YouTube gives you momentum.
Most brands treat these platforms the same. Most end up misallocating budget. The headline takeaway: where a creator lives changes how you should think about them - supply, contactability, growth, and audience quality all behave differently per platform.
The report separates the full 23.6M cross-platform cohort from the 13.2M accounts across its 25 country breakdowns. Each comparison below uses the denominator stated for that metric.
The biggest opportunities come from understanding where scale, access, momentum, and efficiency diverge across platforms.
Most brands optimize for visibility. The best ones optimize for fit. At scale, the difference becomes obvious. Some creators build audiences around craft. Others build audiences around themselves. The economics of partnering with each are not the same.
TikTok leads on account supply. Instagram has the highest public-email listing rate. YouTube has the highest share above the 10% six-month growth threshold and the 100K average-view threshold. Compare platforms like for like: the same content type and the same denominator.
The goal isn't more data. The goal is better decisions.
Start by filtering for relevance - niche, audience geo, audience age. Only then layer in engagement and authenticity signals. Sequencing matters: scoring creators on engagement first will surface optimized but irrelevant accounts.
Use cross-platform context. Don't benchmark a TikTok creator against an Instagram tier or vice versa. The audience and the economics behave differently.
Follower count is one input, not a performance result. Compare accounts using the platform-specific activity, engagement, audience and view fields relevant to the campaign.
Engagement patterns are platform-specific. Instagram medians rise after the 50K-100K tier, while TikTok and YouTube medians decline as creators grow.
This report is a full-year 2025 snapshot. Use current account-level data when a campaign decision depends on recent activity or performance.
In the Instagram cohort, 14.6% of accounts combine good audience quality with at least 2% engagement. This metric covers Instagram only.
Instagram Reels, TikTok videos and YouTube videos use different platform contexts. Compare like with like and keep the threshold, field definition and denominator visible.
TikTok gives you scale. Instagram gives you access. YouTube gives you momentum.
The report compares platform supply, contactability, and growth using each metric's stated denominator.
Click Analytic Creator Economy Report 2026
Common questions
The report studies 23.6 million Instagram, TikTok, and YouTube platform accounts with at least 10,000 followers or subscribers. These are platform accounts, not deduplicated people.
The global report uses a full-year 2025 database snapshot. Its published findings cite Click Analytic, May 2026. Country studies may use later measurement dates and state those dates on each page.
No. The 23.6 million-account research cohort is a subset of Click Analytic's searchable index of 425M+ public profiles. The two numbers use different follower thresholds.
Use the platform-specific definitions and denominators shown with each metric. Activity, engagement, views, and public contact details do not describe the same thing across platforms.
Read the full study on this page, then apply its benchmarks to your next creator shortlist.
Try Click Analytic free