Use 60+ social media KPIs, formulas and documented baselines to measure reach, attention, engagement, conversion, retention and campaign ROI.
By Jules Carmaux
Quick answer
The right social media KPI connects a business goal to a measurable outcome. Use reach and attention metrics for awareness, engagement quality for consideration, conversions and revenue for sales, and retention for loyalty. Choose a small scorecard for each campaign instead of reporting every available metric.
Social media KPIs help teams connect platform activity with revenue, customer acquisition, and long-term brand goals.
For example, a post can reach 500,000 views and drive zero sales. The visible numbers rise, but the business result does not.
This happens because KPIs are treated as universal truths instead of signals tied to a specific goal.
Industry reports change each year, so this guide focuses on definitions, formulas, and documented baselines rather than universal targets.
But the real critical question is: which social media KPIs actually impact your business?
Tracking likes, impressions, and follower growth may inflate dashboards, yet these numbers rarely translate into conversions or revenue without the right framework.
As ad costs and platform distribution change, teams need KPIs that connect social activity with defined business outcomes.
This guide breaks down 60+ essential social media KPIs, grouped by goal and funnel stage.
You’ll learn which metrics matter, how to calculate them, and how to build a reporting structure that aligns social media performance with real business impact.
Here’s what you’ll learn:
✅ 60+ social media KPIs explained with context
✅ Platform-specific social media KPIs
✅ Creator and influencer marketing KPIs
✅ What audience-overlap KPIs measure
✅ How to document creator tracking and attribution
By the end, you won’t track more social media KPIs. Instead, you’ll track the ones that drive decisions.
Build a Documented Benchmark Baseline
To evaluate social media KPIs meaningfully, start with a documented baseline rather than a universal target.
A metric needs context before it can guide a decision. Record the median result from a consistent recent period, then segment it by platform, format, audience size, and campaign goal.
Use that baseline to set a realistic improvement target, and record the date range, sample size, and calculation method beside it.
How to Use Your Baseline
Set expectations by platform: Compare each channel with its own recent performance instead of applying a single “good” number everywhere.
Compare by content type: Evaluate video and static formats separately because platforms measure and distribute them differently.
Track trends over time: Recalculate the baseline quarterly or after a material change in content strategy, audience, or paid distribution.
A documented baseline helps you move from generic metric tracking to goal-driven KPI performance measurement and makes changes in performance easier to explain.
Let’s define social media KPIs before examining each category. 👇
What Does KPI Stand for?
Before identifying the right social media KPIs for your business, first define what a KPI is.
💡 KPI stands for key performance indicator. A KPI measures progress toward a specific marketing or social media goal.
Now, let’s look at what social media KPIs are.
What Are Social Media KPIs?
💡 Social media KPIs are measurable indicators used to evaluate whether a campaign is progressing toward a specific goal.
For example, if your Instagram post generated 10,000 views, that number becomes a meaningful social media KPI when your objective is brand awareness.
If your goal is conversions, however, views alone are not enough ❌
You would need to track click-through rate, conversion rate, or revenue generated.
In other words, social media KPIs connect platform activity to outcomes such as awareness, engagement, traffic, conversions, or retention. They provide evidence for deciding what to change, scale, or stop.
But what is the difference between a KPI and a simple metric?
KPI vs Metric
👉 A metric is any measurable data point.
👉 A KPI is a metric chosen because it reflects progress toward a goal.
Views, likes, impressions, clicks, and followers are all metrics. They become social media KPIs only when they’re tied to a defined objective.
For example, video views can be a social media KPI for awareness. The same views mean nothing for a conversion campaign if they don’t lead to action.
The mistake most teams make is assuming every metric deserves equal attention.
It does not.
Follower and like counts are sometimes promoted as headline KPIs even when they are not tied to the campaign goal.
But here’s the difference between a KPI and vanity metrics 👇
KPI vs Vanity Metric
A vanity metric looks impressive but does not inform a decision.
High follower growth feels good. Viral reach screenshots look convincing.
Those figures do not demonstrate a business outcome if the audience never clicks, converts, or returns.
Social media KPIs force accountability. Vanity metrics create comfort.
💡 Remember this: if a number cannot inform a decision, it should not be a KPI.
Speaking of vanity metrics within social media KPIs, let’s look at Follower Count 👇
Why Follower Count Alone is Misleading
Follower count is one of the most misunderstood social media metrics.
It does not tell you:
❌ Who sees your content
❌ How often they engage
❌ Whether they trust your brand
❌ If they’re likely to buy
Distribution depends on both audience size and how each post performs. Smaller accounts can outperform larger ones when relevance and retention are stronger. Follower count describes potential scale, but it says little about actual performance on its own.
For instance, Adidas’ partnership with Molly Mae worked not because of follower count alone. Her audience already engaged with and wore Adidas organically.
The lesson is to assess audience-brand fit alongside reach and follower count.
A Quick Example of Why KPIs Matter More Than Metrics Alone
Imagine a creator campaign designed to drive signups. Follower growth, likes, and comments may look positive while cost per signup remains too high.
If most engagement comes from outside the target market and few people complete the signup, the original scorecard hid the problem. Choose the KPI after defining the goal.
The next section is going to show you how to define your marketing goal before selecting social media KPIs.
How to Define Your Marketing Goal Before Choosing Social Media KPIs
Social media KPIs only work when chosen after the goal is clear.
👉 Most teams do it backward: they open analytics, pick available metrics, and try to force meaning. That produces reports, not clarity.
A marketing goal answers one question: what should change if this campaign succeeds? Without that, no KPI is reliable.
This guide groups campaigns into five common outcomes. Each needs a primary KPI, a few supporting metrics, and a clear distinction between diagnostic data and the measure of success.
5 Core Social Media Marketing Goals
Here’s a breakdown of key social media marketing goals:
Understanding the social media marketing goals is only the beginning.
Next, we’ll look at how the right social media KPIs align with each goal and prevent teams from tracking irrelevant metrics.
KPI Mapping by Goal
Each marketing goal should have one primary KPI that defines success. Supporting KPIs explain why performance changed, while everything else creates noise.
Marketing Goal
Primary KPI (Defines Success)
Supporting KPIs (Explain Performance)
What NOT to Track
Awareness
Reach or impressions among the target audience
Frequency
Video views or watch time
Follower growth rate
Conversions
Cost per acquisition
Comment sentiment
Engagement
Shares and saves
Comments per post
Average watch time
Total follower count
Raw impressions
Click-through rate
Traffic
Click-through rate (CTR) or sessions
Landing page views
Time on page
Bounce rate
Likes and reactions
Reach without clicks
Follower growth
Conversions
Cost per conversion
Conversion rate
Assisted conversions
Return on ad spend (ROAS)
Engagement rate alone
Reach metrics
Vanity creator metrics
Retention & Brand Equity
Repeat engagement or repeat exposure
Returning audience rate
Creator audience overlap Brand mentions over time
One-off virality
Single-post performance
Short-term clicks
Social Media KPIs by Funnel Stage
Social media KPIs work best as part of a journey, not a checklist. This funnel shows how attention turns into action and which metrics truly matter at each stage.
How to Choose the Right Social Media KPIs
Not all Social Media KPIs serve the same purpose.
The metrics you track should align with where your audience sits in the customer journey.
This funnel framework organizes KPIs based on business impact, from visibility to revenue to long-term loyalty.
Use it as a strategic filter before diving into individual metrics.
How to Use This KPI Funnel
Start at the top.
👉 If your goal is brand visibility or awareness, focus on reach, impressions, and share of voice.
👉 If your goal is community building, prioritize engagement rate, saves, shares, and comments.
👉 If your objective is revenue, measure conversion rate, cost per lead, and ROAS.
And if you want sustainable growth, retention KPIs such as repeat purchase rate and sentiment score become critical.
Each layer builds on the previous one.
Strong awareness without engagement won’t convert.
Strong conversions without retention won’t scale.
That’s why Social Media KPIs must be selected strategically, not randomly.
Now let’s break down each KPI category in detail 👇
🟢 Reach & Distribution KPIs
Reach and distribution KPIs show how far content spreads and whether it reaches the intended audience. Use them as awareness and diagnostic measures; they do not establish engagement or conversion on their own.
1. Reach
Reach is the total number of unique users who saw your content, and it’s relevant because it shows whether your content is reaching the right audience. It also sets the stage for engagement and conversions, and you measure it by counting the distinct accounts that viewed a post or story.
However, be careful not to assume high reach equals success. Keep in mind that without relevance or retention, large numbers can be misleading.
2. Impressions
Impressions track the total times your content was displayed, including multiple views by the same user. They help you understand content exposure frequency and whether posts are getting enough visibility to drive results.
However, don’t confuse impressions with reach. High impressions can hide low unique engagement.
For example, consider these two social media KPIs: 👇
If your campaign reaches 200,000 unique users but generates 450,000 impressions, this indicates repeat exposure.
Frequency = 450,000 ÷ 200,000 = 2.25
Interpret frequency against your own recent campaigns and monitor fatigue signals such as falling click-through rate, weaker retention, or rising negative feedback.
Reach per follower compares unique reach with follower count: (Reach ÷ Followers) × 100. Because reach can include non-followers, label the denominator and do not describe the result as the percentage of followers reached unless the platform supplies follower-only reach.
NOTE: Don’t overlook non-follower reach, which often signals growth opportunities.
4. Median Impressions per Post
Median impressions show the typical number of times a post is displayed without letting one viral result dominate the summary. Keep the same platform, format, and reporting period when comparing medians.
5. Non-Follower Reach %
Non-follower reach percentage is calculated as (Non-follower reach ÷ Total reach) × 100. It shows how much distribution occurred outside the follower base, but not whether those users were relevant or engaged.
6. Discovery Rate
Discovery rate is a custom measure of new users reached relative to a documented denominator, such as total reach or follower count. State that denominator and the reporting window; discovery alone does not establish relevance or growth.
7. Recommendation Reach Share
Recommendation reach share is calculated as (Reach from recommendation surfaces ÷ Total reach) × 100 when the platform exposes a traffic-source breakdown. It describes where distribution occurred, not why the platform recommended the content.
Do not assume all organic reach is cost-free: content production, creator fees, and community management still carry costs.
Placement and recommendation context can change how much attention identical creative receives, so compare feed and recommendation traffic separately when the platform exposes both.
8. Feed vs Recommendation Reach
This compares users who see content in their feed versus via algorithmic suggestions. Keep in mind that feed reach isn’t the whole story. Recommendations often drive new audience growth.
9. Profile Visits
Profile visits count the number of users who visit your profile after seeing content. However, don’t mistake visits for conversions because they indicate interest, not direct action.
10. Distribution Velocity
Distribution velocity measures the change in reach or impressions over a defined period after publication. Compare equal time windows and use it as an early diagnostic rather than a forecast of the final result.
🟢 Attention & Retention KPIs
Attention and retention metrics show how long viewers actively engage with your content. While reach and impressions tell you who saw your posts, attention KPIs reveal whether people actually watched, stayed interested, and came back for more.
These metrics are especially useful for short-form video on TikTok, Instagram Reels, and YouTube Shorts, where the first seconds and later drop-off points can be measured separately.
1. Thumb-Stop Rate
Thumb-stop rate measures the percentage of users who pause scrolling and start watching your content. You can use it to see how effectively your content captures attention in the first couple of seconds.
Keep in mind that clicks or views alone do not indicate that users even stopped to watch.
2. Two-Second Retention
Two-second retention tracks the share of viewers who watch at least the first two seconds of a video. It is an early-attention measure, not proof of later retention, recommendation, or conversion.
Be aware that high view counts can hide early drop-offs.
💡 Pro Tip: Early retention can indicate whether the opening holds attention, but assess it together with completion and rewatch data.
3. Three-Second Retention
Three-second retention shows how many viewers stay through the first three seconds. It helps benchmark whether your hook is effective across platforms. Do not treat all views as equal, because viewers dropping out early may indicate weak creative or misaligned targeting.
4. Five-Second Retention
Five-second retention measures how many viewers continue watching beyond the initial hook. It highlights whether your content maintains interest past the very beginning.
Avoid focusing only on the first two seconds without seeing if attention holds.
5. Average Watch Time
Average watch time calculates the mean duration viewers spend on your video by dividing total watch time by total views.
However, do not rely solely on total views, because a video with many views but a very short watch time is likely underperforming.
6. Watch Time as a Percentage of Video Length
This measures the portion of your video each viewer watches, letting you compare the content of different lengths. Avoid comparing raw watch time across short and long videos without accounting for length.
7. Completion Rate
Completion rate tracks the percentage of viewers who watch the video from start to finish. Remember that even short-form videos need a strong hook, pacing, and narrative to keep viewers until the end.
8. Quartile Retention
Quartile retention shows the share of viewers who reach 25, 50, 75, and 100 percent of your video. However, do not assume average watch time tells the whole story, because quartiles reveal where viewers drop off.
9. Rewatch Rate
Rewatch rate measures the percentage of viewers who watch the same video multiple times. Do not ignore this metric, because a single view does not capture true engagement or resonance.
Expert Tip: Repeated watches can signal that viewers found the content useful or entertaining. Compare rewatch rate with completion and total reach before drawing a conclusion.
🟢 Engagement KPIs That Signal Interest
Engagement metrics describe visible interactions with content. Review likes, shares, saves, and comments separately because each action has different effort and meaning; none proves purchase intent on its own.
1. Engagement Rate by Reach
Engagement rate by reach shows the percentage of users who interact with your content compared with how many actually saw it.
💡 It’s calculated by dividing total engagements by total reach and multiplying by 100.
You can use this to see how compelling your content is to the people who encounter it. Watch out for focusing only on total engagement without considering the size of your audience.
🔖 You can use our free tool to calculate the engagement rate on any influencer or celebrity on TikTok.
2. Engagement Rate by Followers
This metric measures the percentage of your followers who engage with your content.
💡 It’s calculated by dividing total engagements by total followers and multiplying by 100.
It helps evaluate how well your content connects with your existing community.
Let’s look at an example 👇
If an Instagram post receives:
5,000 likes
300 comments
200 shares
50 saves
That’s a total of 5,550 interactions.
If the account has 50,000 followers:
Engagement Rate = 5,550 ÷ 50,000 × 100 = 11.1%
🔖 You can use our free tool to calculate the engagement rate on any influencer or celebrity on Instagram.
However, do not confuse this with engagement rate by reach, as each metric offers different insight.
3. Likes
Likes are simple positive reactions to your content. They can indicate general approval and social validation. Keep in mind that likes alone are not the strongest signal of engagement.
4. Comments
Comments track written responses to your content, giving insight into audience interest, sentiment, and conversation potential. Remember that not all comments are positive; some may be irrelevant or critical.
5. Shares
Shares indicate when users distribute your content to their own audience. You can use this to measure amplification and potential virality.
Be careful not to treat all shares equally because context and relevance matter.
6. Saves
Saves track when users bookmark content for later. This is especially useful for educational, inspirational, or reference-oriented content.
However, do not prioritize likes over saves if your goal is deep engagement.
7. Save-to-Reach Ratio
This metric shows what percentage of viewers saved your content relative to total reach, calculated as saves divided by reach times 100. It helps benchmark performance across campaigns.
Avoid ignoring the audience size, because a large number of saves may seem impressive even if the reach was enormous.
8. Comment-to-Like Ratio
Comment-to-like ratio measures the depth of engagement relative to simple reactions, calculated as total comments divided by total likes. Do not assume that more likes always equal meaningful interaction.
Pro Tip: Compare this ratio only across posts with sufficient like and comment volume; a high ratio from a tiny sample is unstable.
9. Share Rate
Share rate tracks the percentage of viewers who share content, calculated as shares divided by reach times 100. Watch out for audience overlap, as some shares only reach existing followers.
10. Engagement Velocity
Engagement velocity measures how quickly content accumulates interactions after posting. Use it as an early diagnostic, then compare it with the final reach and conversion result rather than treating it as a prediction.
🟢 Community & Relationship KPIs
Community KPIs track recurring interaction and response behavior. They can support an assessment of community health, but trust and loyalty require additional evidence such as surveys, retention, or repeat purchase data.
1. Reply Rate
Reply rate measures the percentage of messages or comments that receive a response from your team. Use this to see how responsive your brand is to audience interactions. Keep in mind that ignoring replies can reduce trust and engagement.
Pro Tip: Responsive community management can support trust and gives the team more context about recurring questions or problems.
2. Conversation Depth
Conversation depth tracks the average number of messages in a comment thread or DM exchange. It measures length, not quality, so review topic, sentiment, and resolution alongside the count.
3. DM Response Rate
DM response rate is calculated as (Eligible direct messages answered ÷ Eligible direct messages received) × 100. Define exclusions such as spam and automated messages before reporting it.
4. Brand-Referencing UGC Volume
Brand-referencing UGC volume counts qualifying user-created posts that mention or depict the brand during a defined period. If you report a rate, state its denominator; review hashtag matches to remove irrelevant or sponsored content where appropriate.
5. Brand Mention Frequency
Brand mention frequency counts qualifying mentions during a defined period. Segment by platform, source, and sentiment, and remove spam or duplicate syndication before comparing periods.
6. Repeat Engager Rate
Repeat engager rate is calculated as (Users who engaged on at least two qualifying occasions ÷ Unique engagers) × 100 over a defined period. It shows repeat behavior, not loyalty by itself.
7. Follower Interaction Frequency
Follower interaction frequency measures qualifying follower interactions per follower or per active follower over a defined period. State which denominator is used and compare like periods.
🟢 Traffic & Click KPIs
Traffic KPIs show how effectively your social content drives audiences to your website or other owned properties. Raw clicks alone don’t tell the full story. You also need to understand the quality and intent behind the traffic to evaluate real impact.
1. Link Clicks
Link clicks measure the number of times someone clicks a link in your post. This helps you see whether your content motivates people to take the next step. Keep in mind that clicks alone don’t guarantee meaningful engagement.
Insider Tip: Context is key. Clicks show interest, but without quality traffic or follow-through, they don’t translate into business results.
2. Click-Through Rate (CTR)
CTR tracks the percentage of people who click a link after seeing your content, calculated as (Link clicks ÷ Impressions) × 100. Use this to compare how effectively content converts exposure into action.
However, be careful not to rely on CTR alone, as high rates can come from low-intent users.
3. View-to-Click Rate
View-to-click rate is the ratio of content viewers who click through, calculated as (Link clicks ÷ Views) × 100. This is especially useful for videos or visual campaigns.
NOTE: Don’t overlook this metric, because CTR alone can hide weak engagement.
4. Sessions from Social
Sessions from social count the number of website visits coming from your social channels. Avoid assuming all sessions are valuable because some traffic may be fleeting or irrelevant.
5. Bounce Rate from Social
Bounce rate depends on the analytics system and configuration. In GA4 it is the inverse of engagement rate; document the definition used and interpret it with conversions and landing-page purpose.
💡 Expert Tip: Interpret bounce in the context of the page goal. A mismatch between the post and landing page can raise bounce, but a short informational visit is not automatically a failure.
6. Time on Site
Time on site measures the average duration of visits from social content. Pair it with completed actions because a short visit can still satisfy the user’s goal.
7. Traffic Quality Score
A traffic quality score is a custom composite of engagement, conversions, and visitor behavior. Document the inputs and weights before using it, and keep raw component metrics available for review.
🟢 Conversion & Revenue KPIs
Conversion and revenue KPIs connect social activity to real business outcomes, such as purchases, leads, or customer lifetime value. These metrics reveal whether your campaigns actually drive measurable impact, which is especially critical for paid campaigns, performance creators, and ROI-focused strategies.
1. Conversions
Conversions measure the total number of desired actions completed, like signups, purchases, or leads. You track this to see the direct effect of campaigns on business goals.
However, be careful not to confuse clicks or visits with actual conversions, since only completed actions count.
2. Conversion Rate
Conversion rate tracks the percentage of users who complete a conversion. Choose one denominator - such as landing-page sessions or qualified clicks - and use it consistently: (Conversions ÷ Chosen denominator) × 100.
Let’s look at a concrete example of one of these Social Media KPIs
If a paid social campaign generates:
8,000 landing page visits
320 purchases
Conversion Rate = 320 ÷ 8,000 × 100 = 4%
Do not apply one conversion benchmark across industries, objectives, attribution windows, and landing pages. Build a dated baseline from comparable campaigns.
Use this social media KPI to understand your campaign efficiency.
Watch for ignoring audience quality or traffic source, which can skew insights.
3. Cost per Conversion
Cost per conversion is the average amount spent to achieve a single conversion, calculated as Total campaign spend ÷ Conversions. Don’t mistake cost per click for cost per conversion, since they measure different outcomes.
4. Revenue from Social
Revenue from social is the revenue attributed to social activity under a stated attribution model. Report the window and model because different rules can assign different values to the same journey.
5. Revenue per Post
Revenue per post averages the income generated by a single post, calculated as Total revenue ÷ Number of posts. Use it to identify top-performing content. Avoid treating all posts equally without considering targeting or context.
6. Revenue per Creator
Revenue per creator measures average attributed revenue across creator partnerships: Total attributed revenue ÷ Number of creators. Report the attribution window and do not compare creators with different roles or spend levels without context.
7. Assisted Conversions
Assisted conversions track actions influenced by social, even if the final conversion happens elsewhere. Don’t overlook this, because social often plays a supporting role in multi-touch journeys.
8. ROAS (Return on Ad Spend)
ROAS measures the revenue generated for every dollar spent on social ads, calculated as Revenue ÷ Ad spend. Avoid using engagement or clicks as a proxy, since they don’t reflect actual returns.
9. CAC from Social (Customer Acquisition Cost)
CAC from social is calculated as Total attributable social acquisition cost ÷ New customers attributed to social. Include media, creator, production, tooling, and relevant labor costs, and state the attribution model.
10. LTV of Social-Acquired Users
LTV measures the average lifetime value of customers gained through social campaigns. Avoid focusing only on short-term conversions, since that misses the full impact of your efforts.
🟢 Platform-Specific Social Media KPIs
Platform-specific KPIs account for differences in formats, available analytics, audience behavior, and metric definitions. Use them to compare like content within the same platform before making cross-platform comparisons.
➡️ Instagram KPIs
1. Reels View Rate
Reels view rate measures the percentage of users who watch your Reel relative to its reach, calculated as (Reel views ÷ Reach) × 100. Remember that a high reach but low view rate can signal that your content isn’t compelling enough to stop scrolling.
💡 Pro Tip: Use view rate with retention, completion, and non-follower reach to understand whether a Reel held attention and reached new viewers.
2. Saves per Reach
This KPI tracks the percentage of viewers who save your post relative to total reach. However, only counting total saves without considering reach can inflate perceived engagement.
3. Story Completion Rate
Story completion rate measures how many viewers watch your Instagram Story from start to finish. A high number of early exits can indicate a weak opening, poor pacing, or a mismatch with audience expectations.
4. Profile Action Rate
Profile action rate tracks the percentage of profile visitors who take an action, such as following, clicking a link, or sending a message. Define which actions count before calculating the rate.
NOTE: Don’t treat profile visits as conversions on their own because not every visit indicates intent.
➡️ TikTok KPIs
1. Like-to-View Rate
Like-to-view rate is calculated as (Likes ÷ Video views) × 100. It describes one visible reaction to the video, but it does not capture watch time, shares, saves, or conversions.
Remember that high views with very few likes can indicate passive consumption or weak engagement.
2. Early Velocity
Early velocity measures views and engagement within a defined period after posting. Compare videos over the same time window and account for posting time, paid distribution, and audience size.
NOTE: Treat first-hour performance as an early signal, not a forecast of the final result.
3. Non-Follower Distribution Velocity
Non-follower distribution velocity measures the change in non-follower views over a fixed period. Compare identical observation windows; the measure describes distribution speed, not relevance or campaign success.
4. Non-Follower View %
This metric calculates the percentage of views from users who do not follow your account. A high value shows that the video reached beyond the existing follower base; it does not by itself prove audience relevance or future distribution.
Watch out for: Overlooking non-follower engagement. Note that relying only on follower metrics can hide growth opportunities.
➡️ YouTube KPIs
1. Views-to-Subscriber Ratio
Views-to-subscriber ratio is calculated as Video views ÷ Channel subscribers. Use the same post-publication window and compare similar formats; the ratio does not reveal whether viewers were subscribers unless YouTube reports that segment separately.
NOTE: Do not compare videos with different ages, formats, or observation windows without normalization.
2. Average View Duration
Average view duration calculates the mean time viewers spend watching your video. Use it with percentage viewed, retention curves, traffic source, and viewer satisfaction rather than assuming one metric determines recommendations.
However, don’t treat total views alone as a key indicator of engagement. A long video with short watch times may perform poorly in recommendations.
3. Returning Viewers %
This measures the percentage of viewers who come back for more content. That being said, don’t just focus on attracting new viewers because loyal audiences indicate lasting impact and retention.
4. Clicks from Description
This KPI counts tracked clicks on links in video descriptions. Use UTM parameters and downstream conversion events to determine whether those clicks produced qualified traffic, leads, or revenue.
However, don’t rely solely on clicks without tracking downstream conversions.
➡️ Facebook KPIs
1. Views (Content Visibility)
Measures how often your content is seen across feeds including photos, video, and text. High views mean content is being served more often. However, views alone do not predict business outcomes so combine with quality signals such as engagement and actions.
2. Weighted Engagement Score
A weighted engagement score is a custom metric that assigns different values to reactions, comments, shares, or clicks. Publish the weights and keep the raw counts beside the score.
3. Click-Through Rate
Click-through rate is calculated as (Link clicks ÷ Impressions) × 100. A high rate followed by weak post-click behavior may indicate a mismatch between the content and landing experience.
4. Action Conversion Rate
Measures how many defined interactions or clicks result in a business action such as a signup or purchase. State the denominator, attribution window, and tracking limitations.
5. Response and Interaction Time
Tracks how quickly the team replies to comments and messages. Compare response time with service-level commitments and customer satisfaction; do not assume it directly changes organic reach.
➡️ LinkedIn KPIs
1. Weighted Engagement Rate
A weighted engagement rate divides a documented weighted sum of interactions by impressions. Because the weights are custom, report them with the result and retain the underlying counts.
2. Click-Through Rate
Tracks the percentage of impressions that produce a click to a website or landing page. Evaluate post-click behavior before describing those visits as high-intent.
3. Profile View Rate
Profile view rate is calculated as (Profile views attributed to content ÷ Content impressions or interactions) × 100. Choose one available denominator and use it consistently; the result does not establish authority by itself.
4. Follower Growth and Audience Quality
Tracks how quickly the audience grows and whether new followers match your target demographic. Prioritize quality growth over volume as irrelevant followers can inflate metrics without business value.
Creator fit, audience quality, content performance, cost, and attribution assumptions all affect how a campaign’s ROI is interpreted.
Click Analytic centralizes creator tracking, audience-quality signals, and campaign results across multiple platforms. Document your attribution windows so results stay comparable.
1. Creator Engagement Rate
Creator engagement rate by followers is calculated as (Qualifying engagements ÷ Followers) × 100, usually averaged across a documented set of posts. State which interactions and platforms are included, and compare creators over similar formats and periods.
NOTE: Avoid comparing raw engagement across creators of different audience sizes, formats, platforms, or observation periods.
Click Analytic can calculate an average creator engagement rate and aggregate it at campaign level. The screenshot below shows where the metric appears in a Click Analytic creator report.
2. Cost per Engagement (CPE)
CPE measures the cost of each interaction with a creator’s content by dividing total campaign spend by total engagements. This helps you evaluate the efficiency of influencer campaigns. Keep in mind that not all likes or shares are equally valuable, so engagement quality matters.
Pro Tip: Compare CPE with conversion, audience-fit, and content-quality measures; low-cost interaction is not automatically a valuable business result.
3. Cost per 1,000 Views
Cost per 1,000 views is calculated as (Campaign spend ÷ Qualified video views) × 1,000. Do not label it CPM, which uses impressions, and compare it only when view definitions and observation windows match.
4. Creator Audience Authenticity Estimate
An audience authenticity estimate combines documented signals such as suspicious growth, follower activity, and engagement patterns. It is a model output rather than proof that an individual account is real or fake; disclose the method and review supporting signals.
5. Suspicious Follower Estimate
A suspicious follower estimate reports the modelled share of an audience showing defined low-quality or anomalous signals.
Use the estimate as one screening input alongside audience fit and recent content performance. Treat it as a screening signal, not a verdict on individual followers.
Click Analytic also surfaces audience-quality signals, including estimates of suspicious or low-quality followers. The screenshot below shows the audience-quality view in a Click Analytic report.
6. Creator Audience Quality
Creator audience quality evaluates how well a creator’s followers align with your target market based on demographics, interests, and location. Avoid choosing creators with large but irrelevant audiences.
7. Creator Growth Momentum
Growth momentum measures the rate and consistency of follower change over a defined period. Review it for unusual spikes and direction of travel, but do not use it to predict virality or campaign reach on its own.
Pro Tip: Positive momentum can indicate rising attention, but it does not guarantee future distribution or campaign performance.
8. Repeat Collaboration Lift
Repeat collaboration lift measures the change in performance across comparable campaigns with the same creator. Control for spend, format, offer, timing, and attribution window before assigning the change to the relationship.
9. Creator Performance Fatigue Signal
A creator performance fatigue signal flags sustained declines in reach or engagement across comparable posts. Before acting, check format, audience saturation, seasonality, and distribution.
10. Earned Media Value (EMV)
Among all Social Media KPIs, EMV is one of the most commonly used metrics for analysing a creator’s performance.
💡 Earned Media Value (EMV) estimates a media-cost equivalent for organic exposure generated through influencer or creator content. The result depends on the selected CPM assumption.
EMV is typically calculated using impressions and industry CPM benchmarks:
EMV = (Total Impressions ÷ 1,000) × Average CPM
Example: If a creator generates 500,000 impressions and your average industry CPM is $10:
EMV = 500,000 ÷ 1,000 × 10 = $5,000
Under that selected CPM assumption, the media-cost proxy is $5,000; a different comparable CPM would produce a different estimate.
Use a dated CPM from your own comparable paid campaigns when calculating EMV. The result is a media-cost proxy, not revenue or profit, and should be labelled as an estimate.
EMV is not revenue or profit. Use it as a stated media-cost proxy alongside reach, engagement, conversion, and actual cost data rather than as proof of campaign return.
11. Click Analytic Edge
Click Analytic centralizes creator content from Instagram and TikTok in one campaign view.
The platform can combine available impressions, likes, comments, views, UTM activity, and promo-code results. State your attribution assumptions when you report results.
By monitoring reach, cost, and outcomes, teams can identify material performance changes and review creator or campaign fatigue.
🟢 Audience Demographics & Overlap KPIs
Audience insights provide context for evaluating whether a creator’s reported audience matches the campaign brief.
Follower and engagement totals do not describe audience composition. Review demographic, geographic, interest, authenticity, and overlap data before you choose a creator.
1. Audience Gender Split
Audience gender split shows the percentage breakdown of your audience by gender.
Use the split to check that the audience matches the customers you want to reach.
2. Age Distribution
Age distribution tracks the percentage of your audience across different age ranges. It is useful for targeting campaigns and optimizing content. Avoid relying solely on average age because distributions reveal pockets of relevance that averages can hide.
3. Top Countries
Top countries measure the geographic distribution of your audience. You can use this for market expansion, localization, or region-specific campaigns. Be careful not to treat all locations as equally valuable.
Pro Tip: Identifying regional opportunities helps optimize ad spend and choose creators strategically.
4. Audience Interests
Audience interests show the topics, categories, or behaviors your audience engages with most. Use this to align content and partnerships with what your audience cares about. Avoid ignoring interest data, as misalignment can reduce campaign effectiveness.
5. Audience Authenticity Estimate
An audience authenticity estimate summarizes defined activity and anomaly signals. It is model-dependent and does not prove whether each follower is a real person; review the underlying indicators and methodology.
6. Audience Overlap Percentage
Audience overlap calculates the percentage of shared followers between brands, creators, or campaigns. You can use it for influencer discovery, partnership evaluation, or competitive analysis. Avoid selecting creators without understanding audience redundancy.
Click Analytic Lookalike Example
Click Analytic helps brands compare audiences between brands and creators to see how much they overlap. This makes it easier to understand whether a creator brings new people or simply reaches the same audience again.
For example, a brand can compare its audience with a creator’s and estimate how many followers the two profiles share. Lower overlap indicates less duplication, not automatic relevance; higher overlap indicates shared accounts, not whether those people know or prefer the brand.
This matters for several key reasons.
✅ Influencer Discovery
Audience overlap helps teams estimate whether a creator may add less-duplicated reach. Combine it with demographic fit, content context, audience quality, and campaign goals before selecting a partner.
✅ Brand Partnerships
Overlap data shows how much two measured audiences are duplicated at a given snapshot. Track it with incremental reach and campaign outcomes; no overlap threshold proves that a partnership adds value or has plateaued.
✅ Competitive Analysis
Audience overlap can show shared followers among measured public profiles. Treat competitor strategy as an inference and validate it with observed partnerships, content, and other evidence.
🟢 Sentiment & Brand Safety KPIs
Sentiment and brand-safety indicators help teams monitor sampled mentions, content adjacency, and emerging issues. They support review and escalation but cannot guarantee that a campaign avoids reputational risk.
1. Positive vs Negative Sentiment
Positive vs negative sentiment tracks the ratio of positive mentions to negative mentions across social channels. Use it to monitor brand perception and campaign impact. Do not focus only on engagement or reach without considering sentiment.
NOTE: A negative sentiment spike is a prompt for investigation. Check volume, source, topic, and sample quality before changing a campaign.
2. Sentiment Trend
Sentiment trend measures how audience perception changes over time, such as daily, weekly, or campaign-specific shifts. Avoid relying on single snapshots because trends reveal emerging issues.
Pro Tip: Tracking trends allows you to adjust content proactively before small issues escalate.
3. Brand Safety Risk
Brand-safety risk records defined incidents or sampled exposure near content that violates the campaign’s suitability rules. State the monitoring coverage and taxonomy because no tool observes every placement.
4. Controversy Exposure
Controversy exposure counts qualifying mentions or interactions tied to a documented set of sensitive topics. Review the underlying context before escalating; volume alone does not establish harm or cause.
5. Crisis Velocity
Crisis velocity measures how fast negative sentiment or issues spread across platforms. Use it for real-time monitoring of PR or campaign risk. Avoid reviewing crises only after they happen.
Pro Tip: Fast-moving issues can affect trust and revenue, so define alert thresholds and an escalation process before a campaign launches.
🟢 Customer Care KPIs
Social media KPI frameworks often focus on reach, engagement, or conversions.
But social media is no longer just a marketing channel.
It’s a customer support channel.
Customers may contact a brand through comments, mentions, or direct messages on several platforms, so response ownership should be defined in advance.
Response expectations vary by channel, issue severity, market, and the service promise a brand has published. Measure against a documented service-level target.
If you ignore customer care KPIs, you’re missing a critical performance layer of your social media strategy.
Here are the key Customer Care KPIs to track:
1. Response Time
💡 Definition: the average time it takes your brand to respond to an eligible comment, DM, or mention.
Why it matters: Faster responses can improve the support experience, but quality and resolution matter as much as speed.
Set targets by channel and issue type. Report the median and high-percentile response time so a small number of very slow cases is not hidden by the average.
Slow responses may affect customer experience, especially when they miss a published service commitment.
2. Response Rate
💡 Definition: the percentage of eligible customer messages your brand responds to.
Formula: (Number of replies / Total incoming messages) × 100
Why it matters: A low response rate can leave customers without help. Segment public comments, direct messages, spam, and cases that do not require a reply.
3. First Contact Resolution (FCR)
💡 Definition: the percentage of eligible customer issues resolved during the first support interaction, without reopening or transfer under the documented FCR rule.
Why it matters: Reducing back-and-forth improves customer satisfaction and reduces workload.
Interpret FCR with satisfaction, quality audits, and reopen rates so premature closures are not counted as success.
4. Customer Sentiment Score
💡 Definition: the measured distribution of positive, neutral, and negative mentions under a documented sentiment method.
You can measure this through: • Social listening tools • Manual tagging • AI-based sentiment analysis
Why it matters: Sentiment is one signal of brand health and should be reviewed with mention volume, source, and topic.
A spike in negative sentiment can reveal a service or communications issue, but automated sentiment should be checked against the underlying messages.
5. Customer Satisfaction (CSAT) via Social
Some brands now send quick surveys after resolving a social support case.
Example: “Was this helpful? 👍 / 👎”
Tracking CSAT from social interactions gives direct feedback on your support quality.
6. Escalation Rate
💡 Definition: the percentage of eligible social inquiries escalated to email, phone, or another team under a documented routing rule.
High escalation rates may signal: • Poor internal processes • Lack of social team training • Product or service issues
A lower escalation rate may indicate stronger frontline resolution, but it can also hide cases that should have been escalated. Audit outcomes, not only the rate.
Customer-care metrics deserve a place beside marketing metrics because unresolved public issues can affect both retention and reputation.
That’s why modern social media KPI frameworks must include customer-care performance, not just marketing metrics.
🟢 Paid & Organic Interaction KPIs
Paid and organic KPIs show how growth strategies interact and amplify each other. Modern marketing teams use these metrics to improve efficiency, creative output, and cross-channel performance.
1. Organic-to-Paid Lift
Organic-to-paid lift compares paid performance for creative previously tested organically with a comparable control. Define the control and test window before attributing any difference to organic validation.
Insider Tip: Use controlled tests to determine whether organic performance predicts paid performance for your account; do not assume the relationship transfers across platforms.
2. Boost Efficiency Ratio
Boost efficiency measures incremental engagements per unit of boost spend: Incremental engagements ÷ Boost spend. Estimate the organic baseline before calculating the increment.
3. Creative Scalability Score
A creative scalability score is a custom composite for performance across campaigns, formats, or markets. Define its inputs, weights, and minimum sample size before comparing concepts.
4. Paid Fatigue Crossover Point
The paid-fatigue crossover point is the frequency or time at which incremental performance begins to decline. Estimate it from comparable cohorts and rotate creative when marginal results worsen, not from one isolated drop.
🟢 Operational & Team KPIs
Operational KPIs track internal cost, timing, and workflow reliability. Use them to diagnose execution constraints, then connect changes to campaign outcomes before claiming an effect on ROI.
1. Content Cost per Post
Content cost per post measures the average cost of producing a single piece of content by dividing the total production cost by the number of posts. Do not forget hidden costs like editing, approvals, or creator fees.
Expert Tip: Reducing cost while maintaining quality improves ROI for both paid and organic campaigns.
2. Cost per 1,000 Impressions
Cost per 1,000 impressions is calculated as (Defined campaign cost ÷ Impressions) × 1,000. State whether the cost includes only media spend or also production and creator fees.
3. Approval Cycle Time
Approval cycle time tracks the average time to review and approve content before publishing. Treat approvals as part of production, because delays can slow campaigns.
4. Creator Onboarding Time
Creator onboarding time measures elapsed time from an agreed start point to a documented ready state. Segment delays by cause instead of assuming shorter onboarding improves campaign performance.
5. Reporting Latency
Reporting latency tracks the time between a defined data cutoff and report availability. Record source delays and avoid presenting incomplete data as final.
🟢 Predictive & Strategic Indicators
Predictive indicators estimate possible outcomes from historical data. They are forecasts, not guarantees.
1. Early Velocity Score
Early velocity score compares initial engagement over a fixed window with a dated, comparable baseline. Do not use it as a substitute for the final campaign result.
2. Growth Momentum Index
Growth momentum index is a custom composite of follower growth, engagement change, and creator performance. Publish the weights, time window, and missing-data rules.
3. Engagement Acceleration
Engagement acceleration tracks how the rate of interaction changes per hour or day after posting. Use the same observation windows and avoid reacting to small samples.
4. Format Breakout Model
A format breakout model estimates the probability that a format will exceed a defined threshold. Train and validate it on relevant historical data, and state the threshold and error rate.
How to Build a Social Media KPI Dashboard for Decisions
A social media KPI dashboard should help its audience decide what to review or change. Automated reports and real-time charts add little value when the owner, threshold, and next action are undefined.
1. KPI Hierarchy
Not all metrics serve the same purpose. A useful dashboard can separate them into this hierarchy:
Primary KPIs: A small set of measures tied directly to the stated goal and decision threshold.
Supporting KPIs: A few measures, such as CTR, engagement rate, or view-through rate, that help investigate changes in the primary KPI without proving their cause.
Context metrics: Measures such as impressions or follower count that help interpret a trend but should be reviewed with the primary and supporting KPIs.
This hierarchy keeps the report focused on the goal, supporting evidence, and context instead of every available number.
2. Separate Dashboard Views by Goal
Separate awareness, engagement, conversion, and retention views when one combined dashboard makes ownership or interpretation unclear.
Awareness Dashboard: Reach, impressions, discovery rate, and non-follower reach %.
Segmentation by goal lets teams quickly identify what’s working, what’s lagging, and where to allocate resources.
3. Weekly vs Monthly KPIs
Weekly KPIs
Monitor short-term signals such as early velocity, engagement acceleration, and individual content results. Use frequent reviews to flag material changes for investigation, not to react automatically to small samples.
For instance, weaker engagement velocity during the first 48 hours may prompt a review of creative, timing, audience, or distribution; it does not identify the cause on its own.
Monthly KPIs
Review outcomes such as revenue, retention trends, and creator performance over a period long enough for the metric to mature. Customer lifetime value may require a longer cohort window than a monthly dashboard.
Together, weekly and monthly KPIs balance real-time optimization with long-term strategic direction.
What to Show Executives
Executives don’t need a dashboard full of every metric. Focus on:
Primary KPI for each goal
Top 2-4 supporting metrics per goal
Revenue, conversion, and retention insights
Creator performance and attribution (where relevant)
Trends rather than isolated numbers
The dashboard should tell a story: Are campaigns moving the needle? Which channels and creators contribute most? What adjustments are required?
If executives cannot quickly identify the outcome, change, and required decision, simplify the dashboard.
5 Common Social Media KPI Mistakes
These common reporting mistakes can make a dashboard misleading. Define the goal, calculation, source, owner, and decision rule for every primary KPI.
It’s important to avoid critical mistakes when looking at social media KPIs.
Let’s uncover ⬇️
1. Chasing Vanity Metrics
Likes, raw views, and follower counts do not demonstrate a business outcome on their own; interpret them against the campaign goal.
❌ Mistake: Celebrating a viral post with 2M views but zero conversions.
✅ Fix: Choose the measure that matches the objective - for example, qualified reach for awareness or attributed conversions for acquisition - and use saves or shares only as supporting evidence when relevant.
2. Over-Reporting
Too many metrics create noise and slow decision-making. Weekly dashboards should focus on actionable signals, not every available number.
❌ Mistake: Reporting 50+ metrics without hierarchy.
✅ Fix: Apply KPI hierarchy: primary, supporting, and context KPIs.
3. Incomplete Creator Tracking
When creator content is in scope, missing creator-level cost, delivery, and outcome data prevents a complete campaign comparison.
❌ Mistake: Counting only branded posts and paid ads while ignoring creator content.
✅ Fix: Track available creator impressions, engagement, conversions, cost, and attributed revenue, and document any platform data gaps.
4. Unclear Attribution
Without a stated attribution method, dashboards cannot explain how credit was assigned to social activity.
❌ Mistake: Reporting CTR, engagement, or reach without stating the campaign objective and the next outcome being measured.
✅ Fix: Choose an attribution model, track assisted conversions, and disclose the model’s window and assumptions when comparing channels or creators.
5. Measuring Platforms in Isolation
❌ Mistake: Adding platform metrics together despite different definitions, or claiming cross-platform influence without supporting evidence.
✅ Fix: Normalize definitions, use audience-overlap and attribution data to estimate relationships, and use controlled tests when a causal claim matters.
Turn Social Media KPIs Into Better-Supported Decisions
Social media KPIs aren’t just numbers.
They provide evidence about what changed, what missed its target, and where further investigation is needed.
Tracked with consistent definitions and context, social media KPIs support more defensible campaign decisions and performance comparisons.
The key is to align social media KPIs with your goals!
How?
Focus on the metrics that match the goal - awareness, engagement, traffic, conversion, or retention - and retain other measures only when they help explain the result. Review audience-quality estimates, creator performance, and overlap with their limitations.
Tools like Click Analytic can centralize creator tracking, audience-quality signals, and campaign results. Use those records with documented attribution rules to make faster, better-supported decisions.
Want to track influencer campaign KPIs? Start with Click Analytic.
The most important social media KPIs depend on your marketing goal. Awareness campaigns focus on reach and impressions. Conversion campaigns prioritize revenue, conversion rate, and ROAS. Context determines relevance.
Review leading indicators at a cadence that matches campaign speed - often weekly - and business outcomes after enough data has accumulated, often monthly. Document the cadence and avoid reacting to very small samples.
Choose KPIs by goal: reach and impressions for awareness; engagement rate, saves, and shares for consideration; clicks and qualified sessions for traffic; conversions, attributed revenue, and ROAS for sales; repeat engagement and customer value for retention.
To measure social media KPIs you can use platform analytics, tracking links, UTM parameters, and tools like Click Analytic. Align metrics with marketing goals to measure performance meaningfully.
Examples of social media KPIs include reach, impressions, engagement rate, CTR, conversions, revenue per post, creator engagement rate, audience overlap %, and sentiment trend. Each social media KPI signals performance at a different funnel stage.
Follower count describes potential audience size, but it does not prove reach, engagement, audience quality, or brand fit. Use it as context alongside current content performance and audience data.
Influencer ROI = (attributed revenue − total campaign cost) ÷ total campaign cost × 100. Include creator fees, products, production, and paid amplification; define the attribution window; and use tracking links or promo codes where appropriate. Report assumptions and do not treat engagement as revenue.
A marketing KPI is a measurable indicator used to track campaign success. It connects specific actions, like clicks or conversions, to business outcomes.
Key Instagram KPIs include Reels view rate, saves per reach, story completion rate, and profile action rate. These social media KPIs measure engagement, retention, and audience behavior.
Core Facebook KPIs include reach, impressions, engagement rate, CTR, link clicks, and conversions. These metrics track visibility, interaction, and business impact.
Metrics are any measurable data points, like likes or followers. Social media KPIs are the metrics that align directly with your goals and measure campaign success. Context determines their importance.
Businesses combine platform analytics, tracking links, UTM parameters, conversion events, cost records, and a reporting dashboard. Choose an attribution model, document its window and limitations, and keep raw source data available for review.
Use reach, impressions, video views, view rate, frequency, and non-follower reach. Segment by target audience and avoid judging an awareness campaign by clicks or conversions alone.
Use engagement rate with saves, shares, comments, and watch time. Compare like formats and audience sizes, and distinguish interaction quality from total volume.
Use link clicks, click-through rate, qualified sessions, and landing-page behavior. Track post-click quality instead of reporting clicks without context.
Use conversions, conversion rate, cost per conversion, attributed revenue, and ROAS. State the attribution window and include assisted conversions where the chosen model supports them.
Use repeat engagement, returning audience, repeat purchases, customer value, and brand mentions over a consistent period. Prefer trends and cohorts over one-off viral results.
Try our influencer marketing platform for free
Find influencer email addresses and contact influencers with Click Analytic influencer marketing software.
Actionable tips to get more success with influencer marketing campaigns.
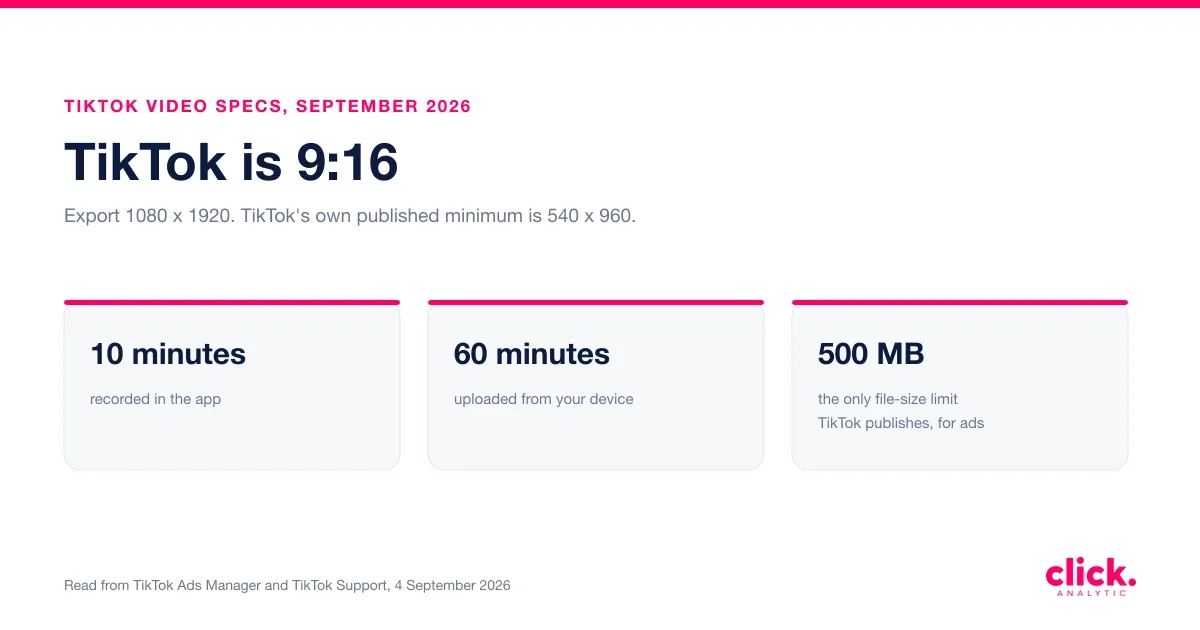
TikTok aspect ratio and video specs
TikTok's aspect ratio is 9:16 at 1080 x 1920. The full spec sheet read from TikTok's own Ads Manager and support pages, the two published length limits, and the numbers TikTok has never published at all.