
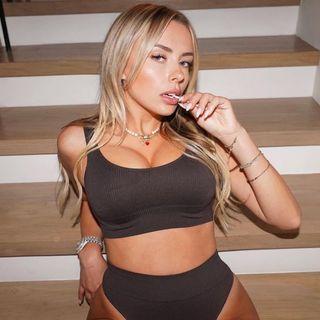
Who is Corinna Kopf?
American lifestyle creator and streamer known online as @corinnakopf
 Jules Carmaux·Profile updated: 11 Sept 2026
Corinna Kopf is an American lifestyle creator and streamer whose public identity uses her own name and the handle @corinnakopf. Her measured accounts total 11,519,491 followers and subscribers across Instagram, TikTok and YouTube. Current posts focus on travel, her home and her animals, while her YouTube archive holds the older beauty videos, house tours, collaborations and personality-led vlogs. Click Analytic measured Instagram on 21 August 2026, YouTube on 9 September 2026 and TikTok on 10 September 2026.
| Click Analytic grade | 80.1 / 100 Instagram audience credibility measured 21 August 2026. 62.49% of followers are classified as real accounts by a separate model. |
|---|---|
| Known as | Corinna Kopf |
| Based in | United States |
| Category | Lifestyle / Travel / Beauty / Streaming |
| Top platform | |
| Audience | 59.9% of her Instagram audience is in the United States, 51.2% is female and 49.8% is aged 18 to 24. Measured 21 August 2026. |
| Average engagement rate | Unlock free with a trial |
| Estimated value per post | Unlock free with a trial |
| Fake followers | Unlock free with a trial |
Who is Corinna Kopf?
Name and accounts
Corinna Kopf publishes under her own name. Instagram and TikTok both use the handle @corinnakopf, while the YouTube channel is registered as CorinnaKopf and displays the name Corinna Kopf. All three reports resolve to the same creator and all three accounts are verified. The Instagram and TikTok reports place her in the United States.
The three measured accounts
Instagram is the largest at 5,479,491 followers, TikTok holds 4,400,000 and YouTube 1,640,000 subscribers, for a combined 11,519,491. That figure adds account sizes together and is not a count of unique people, because one person can follow her on all three. Her Twitch, Snapchat, Facebook Gaming, X and Kick channels are public but carry no measurement, so they stay outside the total.
Instagram is shrinking month by month
Seven monthly readings run in one direction: 5,727,441 followers in February 2026, 5,665,338 in April, 5,534,503 in June and 5,479,491 when the account was measured on 21 August 2026. Every reading sits below the one before it, a loss of about 247,950 across six months. Average likes fell much faster over the same period, from 264,451 in February to 24,267 in August.
Views hold up better than likes
The Instagram engagement rate is 0.44% across 738 posts, low for an account of this size. Video is the exception: Reels average 1,365,376 views, roughly a quarter of the whole following and fifty-six times the 24,267 average likes. TikTok is the opposite case, averaging 659,600 views on a 5.67% engagement rate, the strongest of her three platforms.
YouTube is an archive, not a working channel
The newest upload in the measured YouTube sample is dated 6 February 2020. The channel still averages 1,146,731 views across the 61 videos in the report, but its lifetime view count moved only 89,708 between March and September 2026. Those averages record what the library earned, not what a new upload would earn.
Campaign context for brands
Her disclosed history is real but old. Every name in the partner list comes from an Instagram caption carrying a disclosure: Sony in January 2018, Loving Tan in August 2018, Lulus in November 2018, Flawless Beauty in September 2019 and March 2020, International Loops in May 2020, Lounge Underwear in July 2020, and Rockstar Energy with Cyberpunk 2077 in October and December 2020. The TikTok and YouTube reports return no sponsored-content sample at all, so nothing on this page claims a paid post on either of them.
The thirteen disclosed Instagram posts averaged 331,704 likes, and the five from 2020 averaged 557,502. The newest of them is from December 2020 and drew 594,467 likes, roughly twenty-four times the 24,267 likes the account averages today. That is why this page publishes no sponsored-performance benchmark: every available figure describes an account from almost six years ago rather than the one running now.
For a current brief the three platforms are three different products. Instagram is the broad lifestyle and travel feed, with the largest audience and the weakest engagement rate. TikTok is smaller, faster and more male, with the strongest engagement and the most recent activity. YouTube is a dormant long-form archive that should not be sold as an active placement.
Before contracting, confirm the platform, format, runtime, usage rights, exclusivity and disclosure wording directly with the creator or her representative, and ask for recent paid examples rather than relying on the 2020 set. Two audience facts belong in the targeting review: 8.3% of the Instagram audience and 8.6% of the TikTok audience are aged 13 to 17. Mentions and tagged accounts are not treated as partnerships anywhere on this page.
Per-platform analytics
Followers, engagement and audience quality on each platform, free tiles below, full breakdown with a trial.
Instagram @corinnakopf is her largest measured account: 5,479,491 followers across 738 posts, verified, measured on 21 August 2026. It averages 1,365,376 Reel views, 24,267 likes and 381 comments, which is a 0.44% engagement rate. The report places the account in the United States. Nothing in this section is blended with the TikTok or YouTube snapshots, which were taken on different days.
The recent sample reads as a travel and home diary. An August post about swimming with a dolphin in Turks and Caicos drew 78,246 likes and 415 comments, and another post from the same trip drew 105,566 likes and 391 comments. A girls-trip post on 5 August reached 123,849 likes and 587 comments. July moves indoors to a custom-home tour with 50,406 likes and an introduction to her farm animals with 23,568 likes. One July post asks her followers to stop getting scammed, with 20,267 likes and 577 comments.
Captions are short and personal, and the photograph carries the message rather than any explanation. A brief that needs a product demonstrated should say so, because the organic feed does not work that way.
The all-time top posts sit far above current numbers. The strongest measured post, from May 2021, holds 1,634,865 likes, and ten of the eleven top rows clear a million. None of them are recent. Plan against the 2026 averages rather than against the 2021 peaks.
Audience quality is measured only here. The credibility score is 80.1 out of 100, which is high for an account this large. A separate follower-type model classifies 62.49% of followers as real accounts, 16.96% as mass followers, 11.61% as suspicious and 8.94% as other influencers. The two models answer different questions and must never be added together into a single fake-follower figure.
 SponsoredWho wants to come ride with me? 🏎 You could win this custom @cyberpunkgame 1970 mustang. click the link in my594,467 likes · 4,077 comments
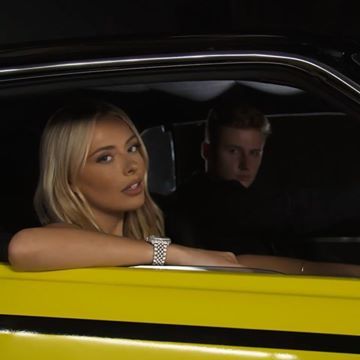 Sponsoredwant to win this car...😏 click the link in bio @rockstarenergy @cyberpunkgame @therockstargarage #rockstarene166,160 likes · 8,913 comments
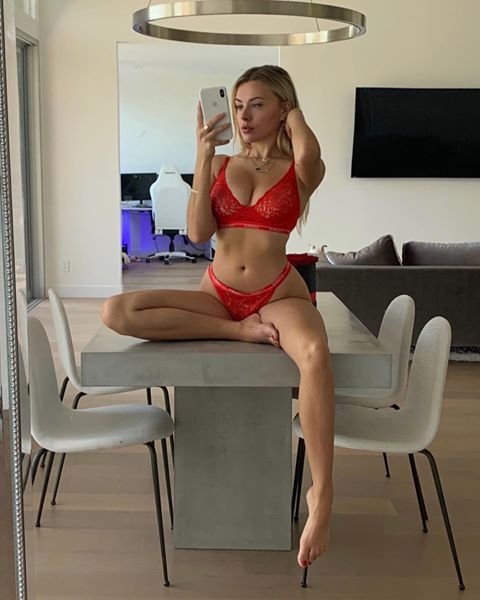 Sponsoredlounging around in my @loungeunderwear , what’s new? discount code corinna10 🤍 #ad993,988 likes · 4,997 comments
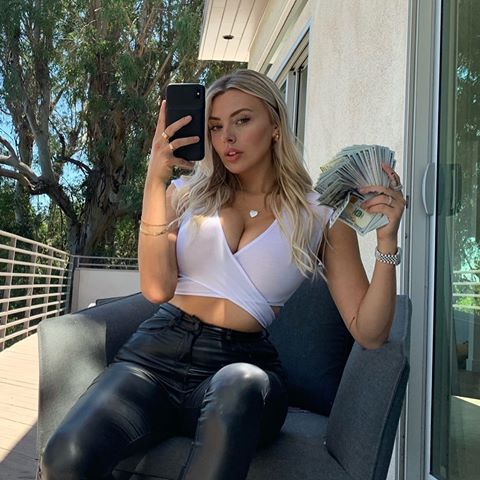 Sponsored🤑CASH GIVEAWAY🤑 (#Sponsored-Ad #Sweepstakes) I partnered with International Loops to give 5 of you a $1000 V708,220 likes · 12,468 comments
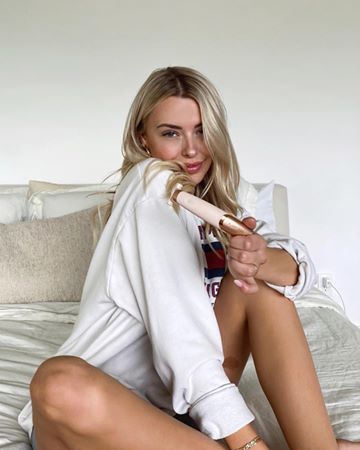 Sponsoredself quarantine, self care!! ❤️ i’ve been loving my Flawless Nu Razor that lets me shave without causing any i324,673 likes · 1,953 comments
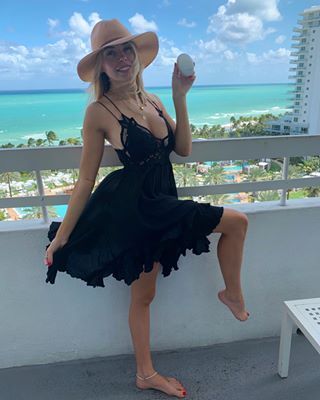 Sponsoredfeeling smooth and flawless on my trip to Miami! 💃🏼 I’ve been loving my @flawlessbeauty Flawless Legs, it ma359,461 likes · 1,884 comments
The recent Instagram sample moves between a Turks and Caicos trip, a dolphin encounter, a custom-home tour and posts about her animals. The captions are brief and personal, so the account reads as a visual lifestyle diary rather than a tutorial feed.
The current sample is far newer than the account's all-time top-post set, which is led by 2021 and 2022 posts above a million likes. This report uses current captions to describe her present subject mix and keeps those historical peaks separate from today's averages.
TikTok @corinnakopf has 4,400,000 followers, and the measured account holds 34 videos. It averages 659,600 views, 26,800 likes and 191 comments, a 5.67% engagement rate, the highest of her three platforms. The account is verified and was measured on 10 September 2026.
Recent clips cover the same subjects as Instagram in a shorter format. The dolphin swim posted on 10 August took 994,900 views, 44,000 likes and 5,460 shares. A 5 August clip captioned "you know" reached 1,100,000 views, 127,600 likes and 12,100 shares, the strongest recent post in the sample. The custom-home video from 31 July took 869,000 views and 55,000 likes, and a farm and house update from 19 July took 659,600 views.
Per-video performance is falling quickly. Average views read 1,333,333 in March 2026, peaked at 1,719,737 in June, then dropped to 678,476 in August and 659,600 in September. Average likes fell from 98,374 in March to 26,800 in September. Cumulative likes on the account still rose over the same seven readings, from 18,300,000 to 19,300,000, so the decline is per post rather than an account losing what it already had.
The older top posts show where the ceiling used to be: 19,900,000 views and 2,100,000 likes on a streaming clip from October 2020, 16,000,000 views in January 2021 and 13,500,000 on a trend video in January 2023. The newer entries in that same top sample are much smaller, at 4,200,000 views in November 2025 and 1,600,000 in June 2026.
TikTok also reaches a different crowd from her other accounts. The audience is 74.1% male and 62.2% aged 18 to 24, with 51.6% in the United States and 8.6% aged 13 to 17. This report returns no credibility score and no follower-type breakdown, so no claim about audience quality can be made for TikTok.
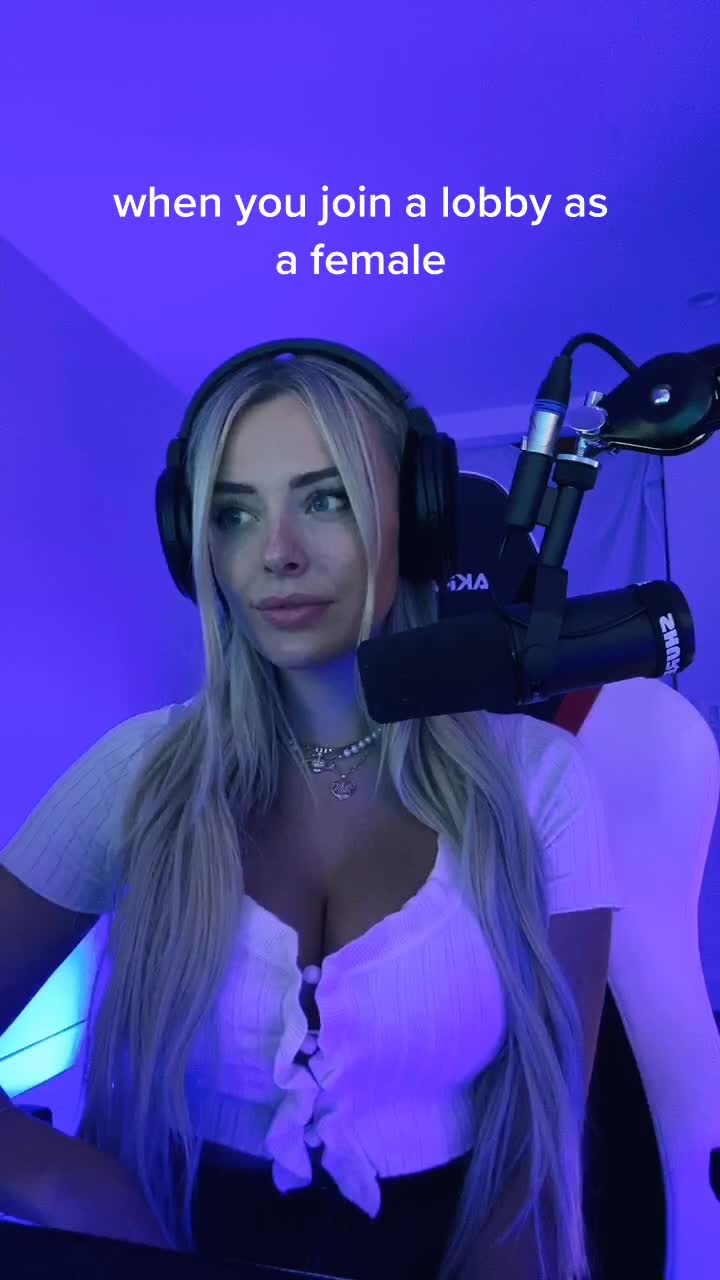 Top postStreamer clip from the measured top-post sample19.9M views · 2.1M likes · 9.6K comments
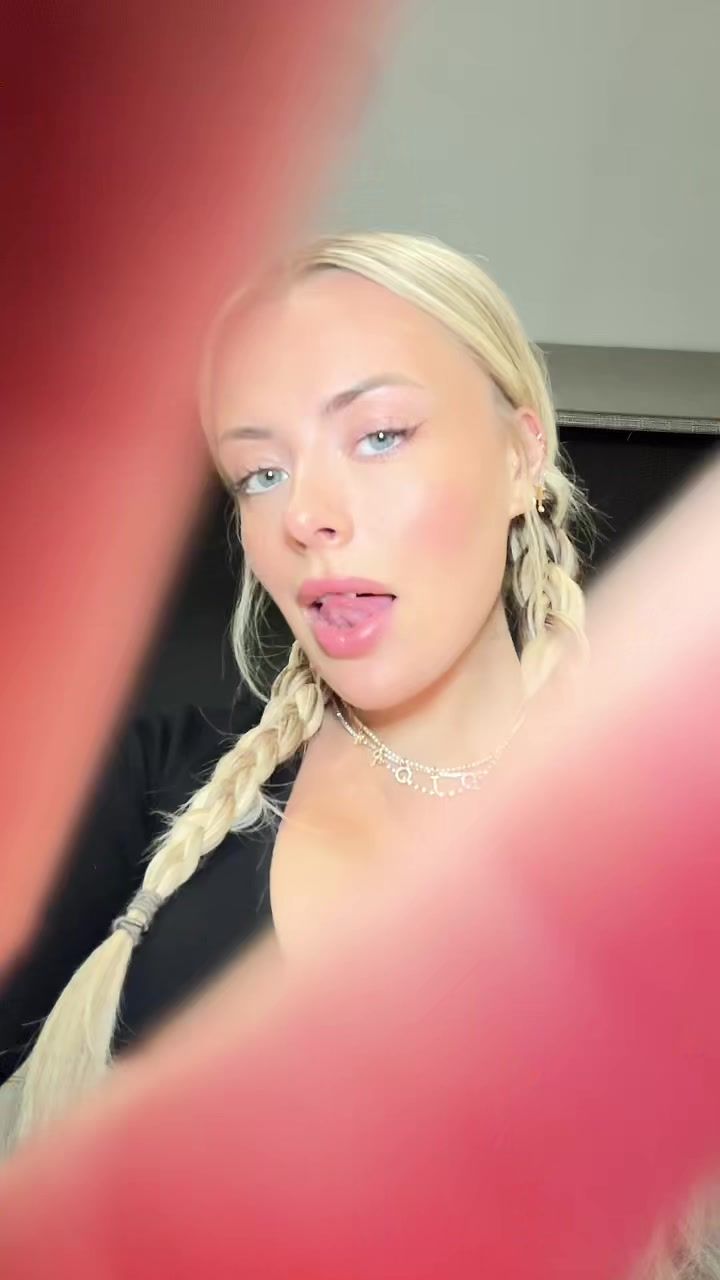 Top postTrend clip from the measured top-post sample13.5M views · 866K likes · 1.9K comments
The selected TikTok previews are vertical, face-led and lightly produced. One places Corinna at a gaming microphone under blue lighting, while another uses a close handheld framing for a trend clip. Both put personality ahead of scenery or product explanation.
Her July and August 2026 captions add travel, a custom-home update and farm life. The top-post previews are older, so their large view counts show historical peaks rather than the result a new post should be expected to reach.
The YouTube channel CorinnaKopf holds 1,640,000 subscribers and 61 videos in the measured report, and was measured on 9 September 2026. It averages 1,146,731 views, 30,815 likes and 1,234 comments, a 3.22% engagement rate. The channel is verified. Subscribers are kept separate from followers and joined only in the clearly labelled combined total.
The dates matter more than the averages here. The newest upload in the measured sample is dated 6 February 2020, a comeback vlog with 3,155,984 views and 3,811 comments; everything below it is 2019 or earlier. Between March and September 2026 the lifetime view count moved from 82,460,804 to 82,550,512, a gain of 89,708 across seven readings. That is the traffic pattern of an archive.
What the archive contains is the long-form half of her career. A July 2017 photo-recreation collaboration holds 5,888,007 views and 269,982 likes, a May 2019 video holds 5,383,807 views and 161,401 likes, a September 2017 sit-down interview holds 3,651,053 views and an October 2017 shopping video holds 4,139,020. Around them sit makeup routines, merch announcements, hair and skin videos, travel and everyday vlogs, several of them carrying discount codes and sponsor links in the description.
Subscribers are drifting down rather than up: 1,650,000 from March through July 2026, 1,642,500 in August and 1,640,000 in September. Average likes moved only from 30,865 to 30,815 and average comments from 1,329 to 1,234 across those seven readings, which is what a static library looks like in the data.
The YouTube audience is the oldest and the most female of the three. It is 63.2% women, 66.9% aged 25 to 34 and only 1.7% aged 13 to 17. The United States supplies 51.9%, the United Kingdom 8.2% and Canada 6.1%. Anyone planning a long-form placement should confirm directly whether the channel is being restarted before using any of these numbers.
 Top postThanks to Booksmart for sponsoring this video - Check out the Trailer - http://bit.ly/WatchBooksmartTrailer7 Y1,302,638 views · 37,987 likes
 Top postit's been a long 5 months but i'm back! I got some of the Vlog Squad to come over to react to my new place! I 3,155,984 views · 3,811 comments
The selected YouTube thumbnails use the classic personality-vlog format: Corinna or a group of collaborators fills the frame, with the idea explained by the title rather than by a polished campaign graphic. The sample includes a photo-recreation collaboration and an everyday makeup video.
The newest upload in the measured archive is dated 6 February 2020, and the channel's lifetime view count moved by only 89,708 between March and September 2026. Its average view figure remains a useful record of the library, but it is not evidence of a current upload schedule.
Who follows Corinna Kopf?
Audience data measured on Instagram, 21 Aug 2026.
Where Corinna Kopf's Instagram followers are, as a share of the audience we measured.
59.9% of them are in United States and 5.6% in United Kingdom. The 5 markets shown cover 75.6% of the measured audience.
How old Corinna Kopf's Instagram followers are.
The largest group is 18-24 at 49.8%. With 25-34 that is 85.8% of the measured followers. 8.3% sit in the 13-17 bracket, which matters if what you are selling is age-gated.
The gender split of Corinna Kopf's Instagram followers.
48.8% male51.2% female
51.2% female, 48.8% male. Close to even, so neither side is a niche here.
What Corinna Kopf's Instagram followers are made of: real accounts, suspicious accounts, mass followers and other creators.
Unlock free with a trialWhat Corinna Kopf's Instagram followers care about, beyond this account.
We track more of Corinna Kopf's audience interests than the ones shown here. See full profile insights
The charts on this page use Instagram
Instagram is the only one of her three reports that returns a full audience dataset: countries, ages, gender, follower types and interests. TikTok and YouTube return countries, ages and gender only. Every chart and every percentage in this block is therefore the Instagram audience, measured on 21 August 2026, and not a blend of the three platforms.
Gender, age and interests
The Instagram following is 51.2% female and 48.8% male. Ages 18 to 24 are the largest group at 49.8%, ages 25 to 34 follow at 36.0%, and 8.3% is aged 13 to 17, which matters for anything age-gated. The strongest measured interests are clothing, shoes and accessories at 23.9%, toys and baby products at 23.6%, and television, film and music at 23.3% each.
Countries and languages
The United States supplies 59.9% of Instagram followers, the United Kingdom 5.6%, Australia 4.3%, Canada 4.0% and Mexico 1.8%. English is the audience language for 87.8%, Spanish is next at 4.2%, and no other language clears 1%. This is an English-first following concentrated in one market.
The three audiences are not the same
TikTok is younger and mostly male, at 62.2% aged 18 to 24 and 74.1% men. YouTube is older and mostly female, at 66.9% aged 25 to 34 and 63.2% women. The United States leads on all three but at different weights: 59.9% on Instagram, 51.6% on TikTok and 51.9% on YouTube. Pick the platform whose audience fits the brief instead of reading the combined follower total as one crowd.
How we analyse creators
Every figure on this page is drawn from Click Analytic platform data and verified public sources, assessed across six signal categories.
Reach & relevance
Followers on every platform the creator actually runs, weighted by how much of that audience sits in your target market. A big number in the wrong country is reach you cannot buy, so the weighting comes first.
Audience profile
Age brackets, gender split, top countries and languages of the people who really see the posts. This is the part that decides whether a creator fits a brief, and it is measured on the account, not guessed from the content.
Engagement signals
Average likes, comments and views on recent posts, compared with creators of the same follower size on the same platform. The comparison matters more than the raw rate: a 2% rate can be strong at 2M followers and weak at 20K.
Audience quality
The share of followers that look like real people versus suspicious, inactive or mass-following accounts, scored 0 to 100 with fake-follower detection on every profile. It is the number that tells you how much of the reach is actually there.
Activity & consistency
Posting cadence over the last weeks and follower growth over 30 days. An account that has gone quiet or is shedding followers performs differently from one that is live and climbing, whatever its size.
Commercial readiness
Sponsored-post history, the brands already mentioned, category fit for your industry and an estimated cost per post. Together they say whether the creator is used to working with brands and roughly what a collaboration costs.
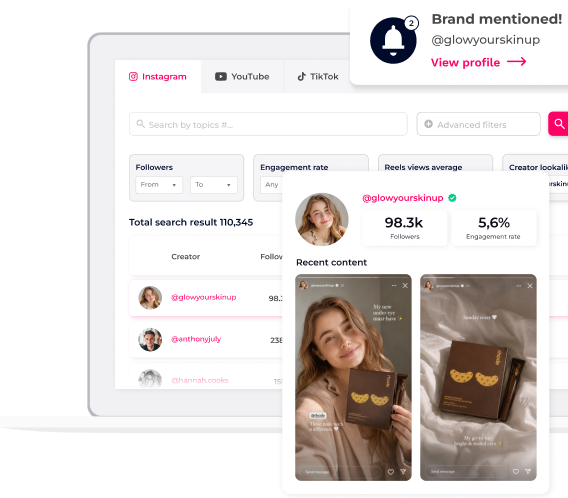
Find creators like Corinna Kopf in seconds
Try it for freeAI-powered search across 400M+ creators

Corinna Kopf, frequently asked questions
Is Corinna Kopf her real name?
Yes. Her accounts and her YouTube display name both use Corinna Kopf, and the three Click Analytic reports link that name to @corinnakopf on Instagram and TikTok and to CorinnaKopf on YouTube.
How many followers does Corinna Kopf have?
Her three measured accounts total 11,519,491 followers and subscribers: 5,479,491 on Instagram, 4,400,000 on TikTok and 1,640,000 on YouTube. That is a sum of account sizes, not a count of unique people, because the same person can follow her on more than one platform.
What is Corinna Kopf's engagement rate?
It is 0.44% on Instagram, 5.67% on TikTok and 3.22% on YouTube. These are platform-specific averages and should not be blended into one number. TikTok is the strongest of the three.
Is Corinna Kopf still posting on YouTube?
The newest video in her measured YouTube sample is dated 6 February 2020, and the lifetime view count moved by only 89,708 between March and September 2026. The 1,146,731 average views describe that archive, not a current upload schedule. Confirm with the creator before planning a long-form placement.
Which social accounts does Corinna Kopf use?
Her own link hub points to Instagram, TikTok, YouTube, Twitch, Snapchat, Facebook Gaming and X, and a Kick channel exists under the same handle. Only Instagram, TikTok and YouTube carry Click Analytic measurements, so only those three are counted here.
How real is her Instagram audience?
The credibility score is 80.1 out of 100, and a separate follower-type model classifies 62.49% of followers as real accounts. The two models measure different things and are not meant to be combined. TikTok and YouTube return neither figure, so audience quality cannot be stated for those two accounts.
Check any creator yourself
Run the same checks we use, free, no login.
Similar creators




Want the full Corinna Kopf report?
Audience quality, location, brand history and benchmarks across every platform, free with a trial.
Start free trial